
Wingo 1 Minute Chart by Date: Reading a Full Day of Rounds
Published 7 November 2026 · 18+ · Entertainment, not an income plan
Every day, a lot of players type a date into a search box and ask for the Wingo 1 minute chart for that day. Some want to check a round they played, some want to see how a whole day went, and some hope an old chart will hint at the next result. Wingo1Min does not publish dated results, and this guide does not either. What it does is show you how to read a full day of one-minute rounds yourself: what each row holds, how the period number carries the date, how to find one round among hundreds, and where the only trustworthy copy of that chart lives. You can practise on the play-money demo at Wingo1Min’s official site, which builds a small history as you watch.
The short version: a chart by date is just the game’s result history filtered to one day. The date sits inside each period number. Read the chart to check rounds you played, never to forecast, and trust only the history inside the platform that took your stake.
What a Dated Chart Contains
A dated chart is not a special document. It is the ordinary result history of one room, cut down to the rounds that closed on one calendar day. Each row is one finished round, and every row carries the same four pieces of information, whatever the app looks like.
| Field | What it shows | How to use it |
|---|---|---|
| Period | The round ID, built from the date plus a running counter | Tells you the day and the place of the round in that day |
| Number | The drawn digit, 0 to 9 | Everything else in the row follows from it |
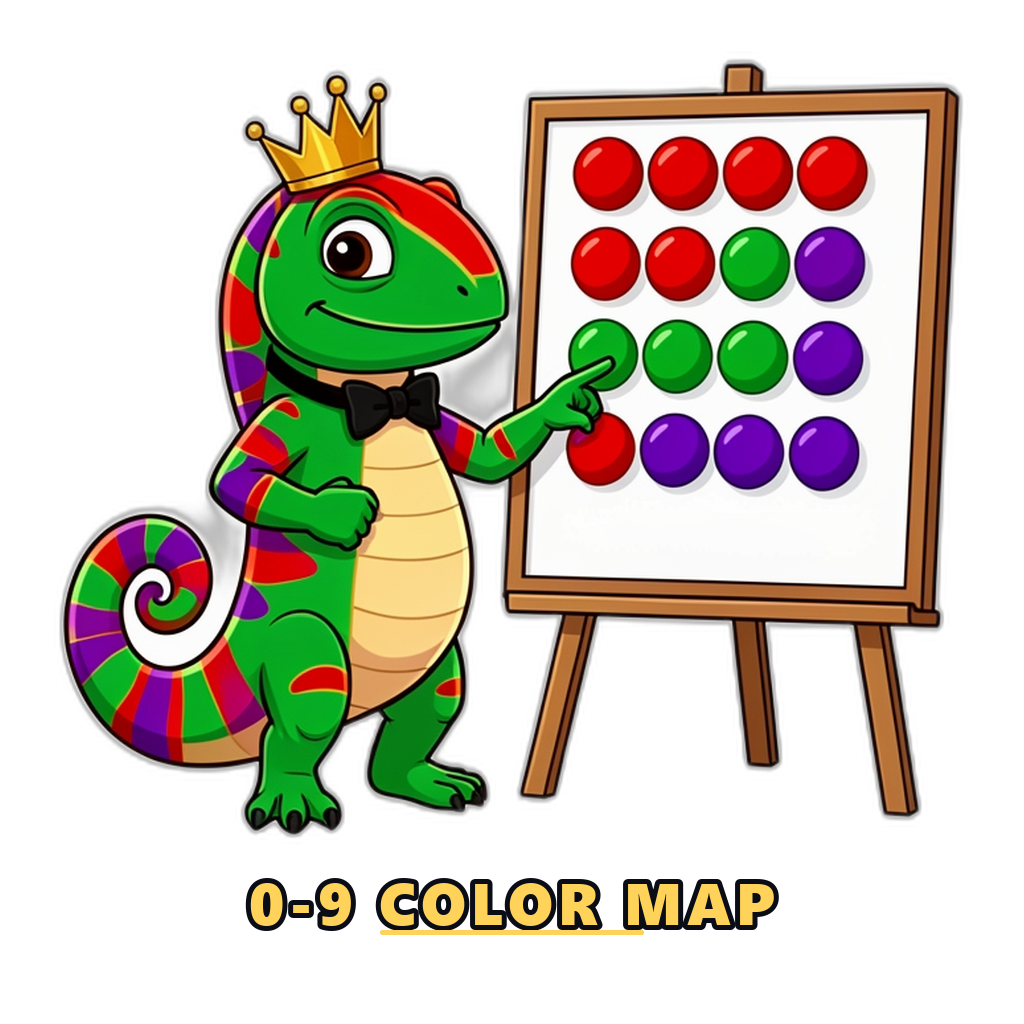
| Colour | Green for 1, 3, 7, 9; red for 2, 4, 6, 8; 5 shows green and violet, 0 shows red and violet | Check colour bets; remember the split colours on 0 and 5 |
| Big / Small | Small for 0 to 4, Big for 5 to 9 | Check size bets |
The size of a full day follows from the round length. A one-minute room closes one round a minute, so a day that runs around the clock has up to 1,440 rows. That is far more than any phone screen shows at once, which is why the history is split into pages or loads more rows as you scroll. Remember also that each room keeps its own chart: the 30 second, 1 minute, 3 minute and 5 minute rooms each run separate draws, so a chart for one of them says nothing about the others.
Reading a Full Day Row by Row
Most in-game histories show the newest round at the top. Reading a full day therefore means starting at the most recent row and working downwards, or jumping to the last page and reading upwards from the first round of the day. Either way, a calm routine stops you getting lost in a long list:
- Confirm the room name at the top of the screen, so you are reading the 1 minute history and not another speed.
- Find the first row whose period shows the day you want, and note its counter.
- Read across each row in the same order every time: period, number, then colour and size.
- Work in blocks, for example sixty rows at a time, which is about one hour of one-minute rounds.
- Stop when the date inside the period changes. That is the edge of the day.
Reading in hour-sized blocks has a second benefit. It shows how quickly the rounds pile up. Sixty results an hour is a lot of decisions, and seeing a full day laid out is a useful reminder of why a fixed stop time matters more than any reading of the chart. If you want a column-by-column tour of the board itself, see the Wingo1Min piece on the minute panel, which explains the trend view and the “missing” counts many apps add on top.
Matching Rounds to Period Numbers
The period number is the key that turns a long list into a dated chart. On the demo on our homepage, the period starts with the year, month and day written as eight digits (YYYYMMDD), followed by a fixed block and a four-digit counter that goes up by one with every round. Real platforms use similar date-plus-counter codes, but the fixed block and the counter length differ, so read your own app’s format before you rely on it.
| Part of the period | What it means | What to check |
|---|---|---|
| First eight digits | Year, month and day of the round | That they match the day you are looking for |
| Middle block | A fixed code for the room or game | That it stays the same for every row you read |
| Last digits | The running counter for that day | That it rises by one per round with no gaps |
The counter also tells you roughly when a round happened. If the counter starts when the day begins and rises once a minute, round 60 is about one hour in and round 600 is about ten hours in. Treat that as an estimate. A platform may start its day on its own server clock rather than your phone’s clock, so a round you played just after midnight can sit at the end of the previous day’s chart. When the time matters, for example in a support request, quote the full period rather than the time.
To match a round you played, take the period from your own bet record, find the same period in the public history, and compare the number, colour and size. Our guide to live results walks through that check step by step and lists the usual reasons a result seems wrong when it is not.
Why Yesterday’s Chart Does Not Predict Today
A full day of rounds looks like it should contain a message. Over hundreds of rows you will always find streaks of one colour, digits that disappear for a long stretch, and hours where Big seems to win more often than Small. That is what a fair random draw produces on its own. Each round is drawn independently, so the first round of today has no memory of the last round of yesterday.
- A long day hides more coincidences. With up to 1,440 rows, rare-looking runs are not rare at all. They are expected somewhere in the list.
- Same date, different meaning. A chart for one date on one platform is unrelated to the chart for the same date on another, because every platform draws its own rounds.
- “Prediction by date” pages sell hindsight. A page that shows a dated chart next to the “predictions” that matched it was written after the results were known.
The honest use of an old chart is to look at your own decisions on that day: how many rounds you played, whether your stakes crept up after a loss, and whether you stopped when you planned to.
Where to Verify a Round
Only one chart settles your money: the result history inside the platform where you placed the stake. Screenshots in groups, video recaps and websites that post a chart for each date are at best copies of one platform and at worst made up, and you usually cannot tell which. When you need to check a round:
- Open your personal bet record in the app and note the full period of the round.
- Open the 1 minute result history in the same app and find that period.
- Compare number, colour and size, and check how the stake was settled.
- If the two screens disagree, take a screenshot of both with the period visible.
- Contact support only through the help option inside the app, with the period and screenshots.
Some histories only keep a limited number of past rounds on screen. If you think you may need to check a day later, take your screenshots on the day instead of hoping to find the rows afterwards.
Practise Reading a History With Play Money
The free demo adds a new row to its result history every round, so you can practise matching periods and results without any risk.
Play Safely and Responsibly
A chart by date is a record of rounds that are already over. Play only if you are 18 or older, decide your money and time limits before the first round, and never pay anyone for a “date-wise” prediction, a chart file or a VIP number.
Wingo involves real money and real risk. Only adults (18+) should play, and no result can be guaranteed. Read our full limits and help page for budgets, limits and support resources.
Frequently Asked Questions
Where can I see the Wingo 1 minute chart for a past date?
Inside the result history of the platform you play on, in the 1 minute room. Look for the rows whose period starts with that date. Outside sites that post a chart for each date are copies of one platform at best, and you cannot check where they came from.
How many rounds are in one day of the 1 minute room?
Up to 1,440 if the room runs all day, because one round closes every minute. Apps show them in pages or load more rows as you scroll, and some only keep a limited number of past rounds on screen.
Can a chart from a previous day help predict today?
No. Each round is drawn independently, so streaks and gaps in an old chart carry no information about the next round. Use an old chart to check rounds you played and to review your own decisions.
Why does my round appear under the wrong date?
The platform's day may start on its server clock rather than your phone's clock. Rounds played close to midnight can fall on the other side of the date change. Quote the full period number, not the time, when you ask support about a round.
Related Guides
- Wingo 1 Min Live ResultsWhere one-minute Wingo live results really come from, how to read and verify a settled round by its period number, why outside "live result" sites lag or lie, and what to do if a result looks wrong.
- Wingo 1 Minute Panel GuideWingo 1 minute panel explained for beginners: what the panel shows, how period numbers, colours and big/small results are laid out, why panel patterns cannot predict the next round, and how to use the chart safely.
- Wingo Prediction Chart GuideWingo prediction chart guide: how result charts and trend graphs are laid out, what streaks and patterns really mean, why charts cannot predict the next round, and how to use them without fooling yourself.
- 1 Minute PredictionWingo 1 minute prediction guide: how the 1 min round timer works, period numbers, betting windows, bankroll tips and honest advice about fast color prediction rounds.
- Wingo GameWhat is the Wingo game? Rules, red green violet payouts, big and small options, 30 second to 5 minute versions, and how the online lottery-style game works in India.
- Responsible GamingResponsible gaming guide for Wingo and color prediction players: budgets, time limits, warning signs of problem gambling, self-exclusion, and where to find help in India.